Data without context is meaningless.
Recent weeks have seen the publication of large amounts of data on every aspect of COVID-19: from case fatality rates to unemployment statistics to environmental effects. But without some sort of conceptual framework to make sense of this flood of information, it’s just noise.
In this extended essay I offer such a framework, for understanding the economic impact of COVID-19.
Table of Contents
- The Economic Impact of COVID-19
- The Garden of Forking Paths
- History: Just One Damn Thing After Another
- Data Rules Everything Around Me
- Loops and Linearity
- What I Think About When I Think About Data
The Economic Impact of COVID-19
It is now clear that the US economy has been plunged into a sharp recession by COVID-19. The question currently facing individuals, organizations and policymakers is: what happens next?
How deep will the downturn be? How long will it last? And how quickly will the economy recover once the worst of the virus is past us?
The Garden of Forking Paths
I see three possible paths for the economy to take.
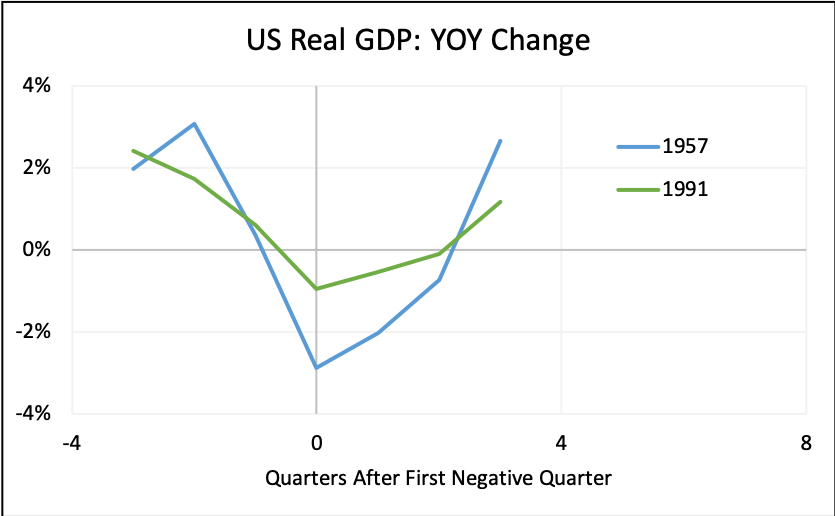
In the first and most optimistic scenario, the impact of the virus is limited to “only” health and mortality effects; there are no long-term economic consequences. Government rescue packages succeed in bridging the short-term needs of both corporations and consumers. Once lockdowns are relaxed, possibly as soon as the end of Q2, a wave of pent-up demand is unleashed. The economy comes roaring back with above-trend growth in Q3-Q4. There’s a V-shaped recovery: think 1957 or 1991.
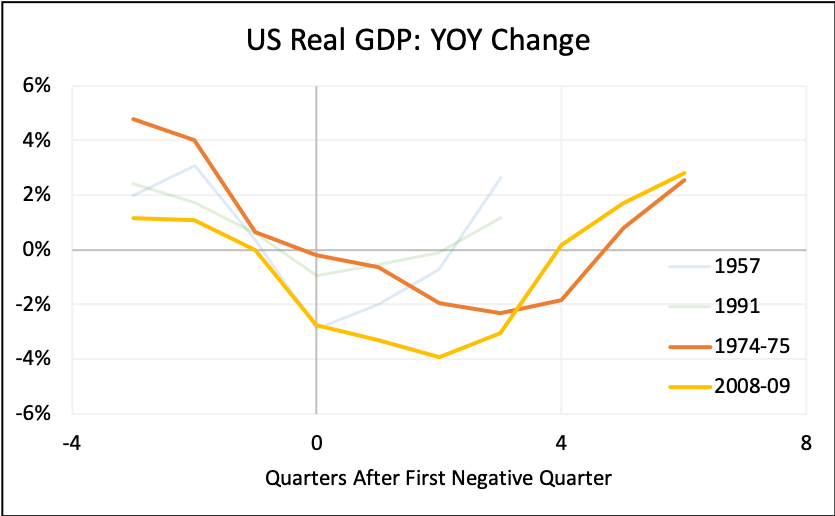
In the second, somewhat pessimistic scenario, the economy takes longer to recover. Many small businesses fail. Unemployment spikes and stays high. Consumption drops. A few industries are decimated and see multiple bankrupcies (airlines, entertainment). Monetary and fiscal policy help, but they can only cushion the blow. The recession is prolonged, and the recovery, when it comes, is U-shaped: think 1974-75 or 2008-09.
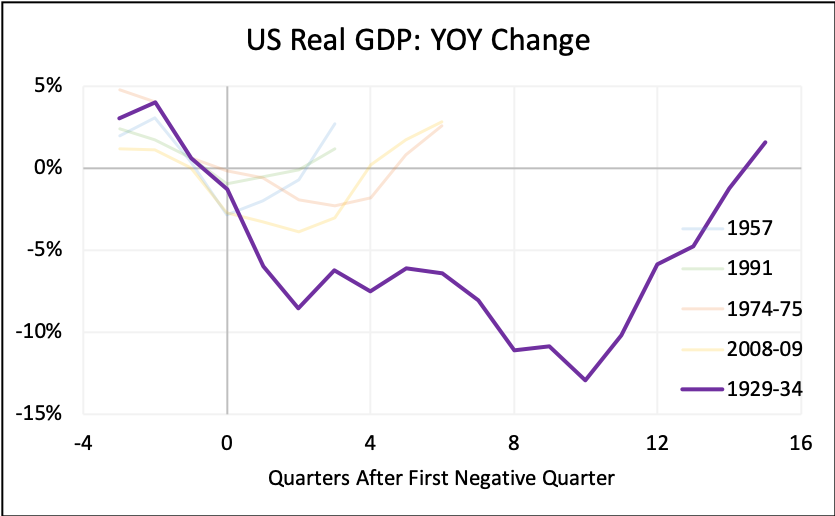
The third scenario is the bleakest. Here, the desolation of small business and individual balance sheets spreads beyond those two segments. Falling consumption triggers a negative feedback loop. Borrowers begin to default on rent and business loans and personal debt. Lenders suffer massive writedowns. Credit dries up, and the economic crisis turns into a financial crisis. (Usually it’s the other way around). Small businesses find it hard to restart. Unemployment becomes structural. Other wild cards come into play: supply chain disruption, infrastructure failure (water, food, power), institutional collapse. Society is profoundly reshaped by the pandemic and its aftermath. Think Great Depression, or Panic of 1873: once-in-a-century events.
History: Just One Damn Thing After Another
Another way to think about these 3 scenarios is as the outcomes of a series of dominos falling. The first domino is healthcare; the second is direct economic impact; the third is indirect and macro impact.
The healthcare domino has already fallen. It seems inevitable that we’ll have hundreds of thousands of deaths worldwide this year. And if that’s the worst of it, we’ll be lucky – believe it or not, this is the optimistic scenario.
The second domino is small business and individual consumers and specific vulnerable sectors. How badly will the disease (and society’s response to it) directly affect production, consumption and employment for these groups?
And the third domino is macro effects. We know the disease directly impacts certain areas of the economy; will that impact spill over to previously unaffected sectors? That would be true contagion (in the financial and economic sense, not the infectious disease sense).
Data Rules Everything Around Me
How do we know which of these scenarios is actually playing out? More precisely (and tying in with my personal proclivities), how should we use data to confirm or reject the above hypotheses for the economy?
The domino analogy is the key here. We should consciously seek out and bucket and analyze data based on which of our three dominos it speaks to: disease, micro, macro. This is the framework that best allows us to assess the relevance in context of any incoming information.
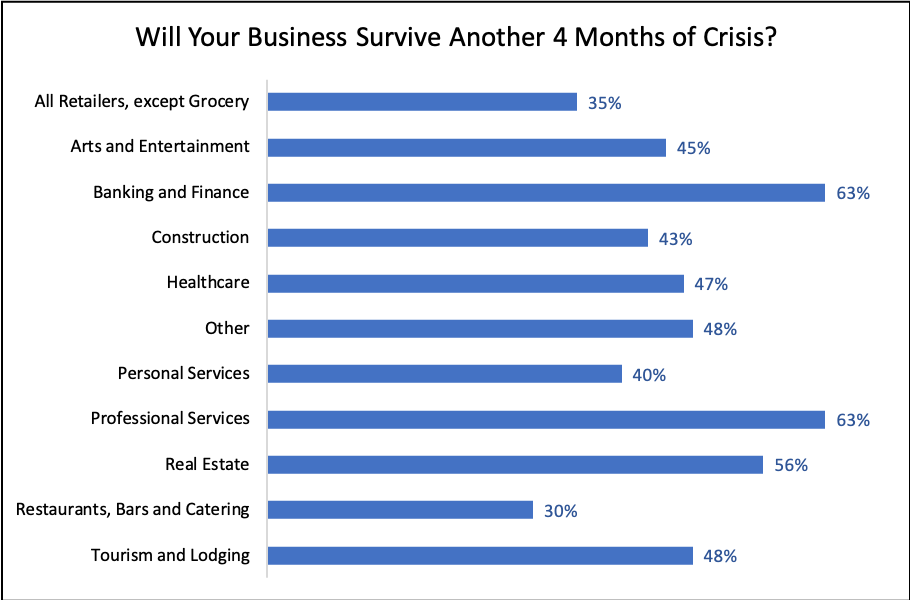
For example, if we were to see data from an NBER survey suggesting that only 35% of small businesses think they will survive should the crisis last another 4 months, that would impact the probability we assign to the second domino falling. Our framework thus tells us which bucket to put that data into, and what the likely consequences are, and how to adjust our forecasts.
Loops and Linearity
Of course, it’s not that simple; it’s never that simple. The complicating factor here is feedback loops.
Consider the small business example above. If your prior estimate was that 50% of small businesses would be able to reopen in Q3, the new estimate of 35% should make you increase the odds of a deep recession, as the second domino falls. But of course that’s conditional on the crisis lasting another 4 months or more, which now means you now have context for the timelines for the data around the first domino: vaccine development or clinical trials or herd immunity.
And it doesn’t end there. The very conditions necessary for small businesses to remain closed for 4 months (lockdowns, shelter-in-place, social distancing) are also likely to diminish the spread of the virus, buying time for healthcare system responses (fast test-and-trace, more ventilators and PPE, vaccines and treatment) that will lead to a long term “solution” or at least a stable equilibrium. Meanwhile if small businesses do fail in large numbers, we may see even more aggressive government support. Both of these decrease the probability of the third domino falling, even as the second domino teeters.
Then again, governments may react to the possibility of a small business apocalypse by rescinding lockdown orders, which would mitigate the immediate economic effects but at the risk of pushing on the third domino via a Q3 resurgence in cases and fatalities.
The thing to watch out for here is positive feedback loops. Most of the dynamics associated with COVID-19 are negative feedback. Worse expected outcomes typically prompt stronger preemptive measures, which ameliorate those very outcomes. (And vice versa). But if that’s not the case – if bad news begets further bad news – you can have cascading failures. Financial systems are very familiar with this dynamic (Ponzi schemes, bank runs, short squeezes), but the example of northern Italy suggests that it can happen in healthcare systems as well.
What I Think About When I Think About Data
This is just one framework; there may be others that are equally robust. But the important thing is to have a framework; in other words, to be aware of context.
The point is not to get everything correct. In such a fast-moving situation with so many unknowns, that’s an impossible and indeed counter-productive aspiration. The point is to be thoughtful and rigorous in our assimilation of new information.
By examining data in this disciplined manner – always keeping in mind asymmetric outcomes, the precautionary principle, fat tails and unknown unknowns, systemic fragility: in other words, the known limitations of any overly structured approach – we put ourselves in the best possible situation to understand it, and hopefully act on it.
But don’t wait too long to take that action! Analytical thinkers are especially prone to making this mistake: waiting until the data makes the right decision unambiguously clear. I don’t think we have that luxury with COVID-19; the virus moves a lot faster (both in terms of spread, but more importantly in terms of social and economic impact) than most individuals can react, let alone institutions. And human brains are not equipped to truly intuit exponential processes. It’s better to take rapid action based on the data you have, even if it’s not 100% certain, than to wait for perfection.
(To be continued… )